Notes and coin in circulation
The accompanying table shows a breakdown of notes and coin in circulation. The total figure is entered on the liabilities side of the Central Bank´s balance sheet.
In most cases, money in circulation refers to cash outside the Central Bank and deposit money banks. The difference between that figure and the total in the balance sheet is the deposit money banks' overnight cash balance, namely the notes and coin on the asset side of the DMBs' balance sheets at the end of the business day. Part of this cash is kept in the branches of commercial banks and savings banks, and the remainder in their ATMs.
|
Notes |
Notes in circulation at the end of January 2025 |
% |
|
10,000 kr. |
39,755,870,000 |
62.3 |
|
5,000 kr. |
14,862,650,000 |
23.3 |
|
2,000 kr. |
205,997,000 |
0.3 |
|
1,000 kr. |
7,093,365,000 |
11,1 |
|
500 kr. |
1.898,285,250 |
2.9 |
|
Total |
63,816,167,250 |
100.0 |
|
Coin |
Coin in circulation at the end of January 2025 |
% |
|
100 kr. |
3,059,100,000 |
64.6 |
|
50 kr. |
786,690,000 |
16.6 |
|
10 kr. |
631,400,000 |
13.3 |
|
5 kr. |
133,624,000 |
2.8 |
|
1 kr. |
121,998,000 |
2.6 |
|
Total |
4,732,812,000 |
100.0 |
|
|
|
|
|
Total in circulation |
68,548,979,250 |
|
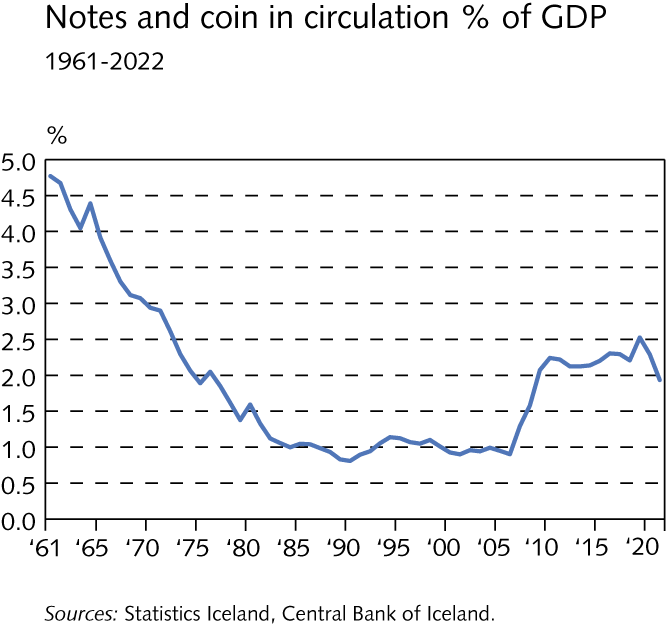
Below is a chart showing notes and coin in circulation as a proportion of GDP. For some time, this proportion remained close to 1%; however, it rose after the Icelandic banking crisis struck in October 2008, reaching 2.6% by year-end of 2020.

